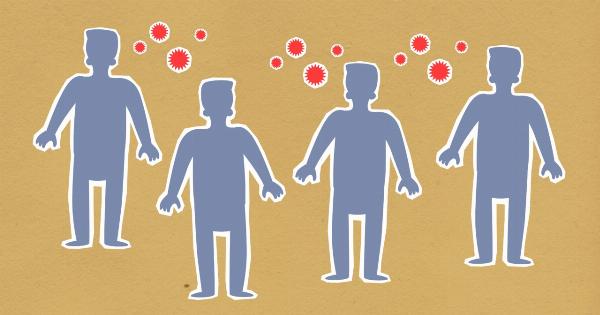
Influenza, commonly known as the flu, is a highly contagious respiratory illness caused by influenza viruses. Every year, millions of people around the world are affected by the flu, leading to significant morbidity and mortality.
To combat the flu and develop effective prevention and treatment strategies, it is crucial to understand the life cycle of the virus. In this article, we will explore the different stages of the flu life cycle and how visualizations can help us better understand this infectious disease.
Stage 1: Entry and Attachment
The flu virus enters the body through the respiratory tract, typically through inhalation of respiratory droplets containing the virus. These droplets can be expelled when an infected person coughs, sneezes, or even talks.
The virus then attaches itself to the cells lining the respiratory tract, particularly the epithelial cells in the nose and throat.
Stage 2: Invasion and Replication
Once attached to the respiratory cells, the flu virus invades them and takes control of their cellular machinery.
The viral genetic material, composed of RNA, is released into the cells, and the virus starts replicating itself using the host cell’s resources. This replication process generates numerous copies of the virus within the infected cells.
Stage 3: Spread and Transmission
The replicated flu viruses are released from the host cells, mainly by causing the infected cells to burst open. These newly released viruses can then infect nearby cells, continuing the cycle of replication and spreading the infection further.
Additionally, the flu virus can also spread to other individuals through direct contact or exposure to respiratory droplets containing the virus.
Stage 4: Symptoms and Immune Response
As the infection progresses, the immune system recognizes the presence of the flu viruses and mounts a defensive response. This immune response leads to the development of flu symptoms, such as fever, cough, sore throat, muscle aches, and fatigue.
The symptoms vary in severity and can range from mild to severe, depending on the individual’s immune system and the specific strain of the flu virus.
Stage 5: Shedding and Contagiousness
During the symptomatic phase, individuals infected with the flu virus can shed the virus and spread it to others. Shedding refers to the release of viral particles from the respiratory tract, primarily through coughing and sneezing.
The contagiousness of influenza is highest during the first few days of symptoms but can continue for up to a week or longer in some cases.
Stage 6: Recovery and Immunity
Most individuals infected with the flu virus will eventually recover from the illness. The immune system successfully fights off the infection, gradually clearing the virus from the body.
Once recovered, the individual develops immunity to the specific strain of the flu virus they were infected with, providing protection against future infections with the same strain.
Stage 7: Long-Term Complications
Although most people recover without any long-term complications, the flu can sometimes lead to severe complications, especially in vulnerable populations.
These complications can include pneumonia, bronchitis, sinus infections, ear infections, and worsening of underlying chronic medical conditions. Visualization techniques can help researchers and healthcare professionals better understand the risk factors and outcomes associated with these complications.
Using Visualizations to Understand the Flu Life Cycle
Visualizations play a crucial role in understanding complex biological processes like the flu life cycle. They help researchers and healthcare professionals visualize the various stages of the flu infection and its impact on individuals and populations.
By representing the flu life cycle visually, important patterns and relationships can be identified, leading to new insights and discoveries.
The Benefits of Using Visualizations
Visualizations make complex data more accessible and understandable. They enable researchers to identify trends, patterns, and anomalies that may not be apparent when looking at raw data alone.
By clearly visualizing the flu life cycle, researchers can gain a comprehensive understanding of how the virus spreads, how it affects different age groups and populations, and how interventions can be targeted to reduce its impact.
Types of Visualizations for the Flu Life Cycle
There are various types of visualizations that can be used to represent the flu life cycle:.
1. Transmission Networks
Network visualizations can illustrate the spread of the flu virus in populations. Nodes represent individuals, and edges represent transmission events between them.
By analyzing these networks, researchers can identify super-spreaders, high-risk groups, and potential intervention strategies.
2. Time-Series Plots
Time-series plots visualize the temporal patterns of flu infections over a specific period. These plots help identify seasonal trends, outbreak durations, and fluctuations in the number of flu cases.
They can also highlight the effectiveness of interventions, such as vaccination campaigns.
3. Geographic Heat Maps
Heat maps showcase the geographical distribution and intensity of flu infections. By color-coding regions based on the prevalence or incidence of flu cases, researchers can identify hotspots and patterns of spatial spread.
These visualizations aid in targeting resources and interventions where they are most needed.
4. 3D Models
Three-dimensional models of the flu virus can provide insights into its structure and interactions with host cells. These models help researchers understand how the virus attaches to cells, how it invades them, and how it replicates.
Such visualizations inform the development of antiviral drugs and vaccines.
Conclusion
Visualizing the flu life cycle is essential for understanding the mechanisms of flu infection, transmission, and the impact of interventions.
By utilizing various visualization techniques, researchers can gain valuable insights into this infectious disease, leading to improved prevention and treatment strategies. These visualizations play a crucial role in combating the flu and mitigating its societal and economic burden.


