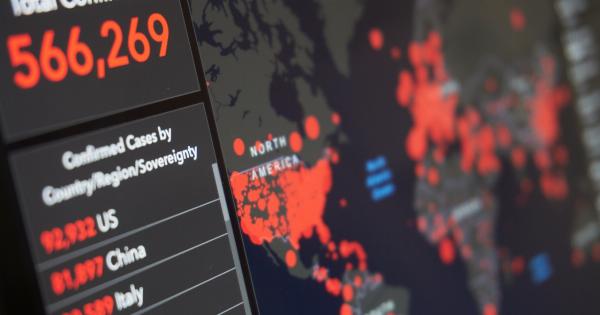
In this era of rapid technological advancements, visualizing data has become an integral part of decision-making and overall progress in various industries.
The ability to represent complex information visually allows us to better understand patterns, trends, and relationships, ultimately paving the way for future developments and improvements. Whether it is in healthcare, finance, urban planning, or any other field, mapping the present using visual tools has proven to be invaluable.
In this article, we will explore the importance of visualizing data in today’s world and how it can drive future progress.
The power of visual representation
Humans are visual beings. We process images much faster than text and are more likely to remember visual information. This is why visual aids are so effective in conveying complex ideas and concepts.
When it comes to data, visuals help us make sense of large amounts of information by presenting it in a digestible and easily understood format. Instead of poring over spreadsheets and endless rows of numbers, we can quickly grasp the key insights by visualizing the data.
By employing charts, graphs, maps, and other visual tools, we can identify patterns, trends, outliers, and correlations that may not be apparent in raw data.
This visual representation allows us to communicate complex information to a wider audience and enables decision-makers to gain new perspectives and make informed choices.
Mapping the present for healthcare
Visualizing data has proven particularly valuable in the healthcare industry. By mapping healthcare data, we can identify areas with the highest prevalence of diseases and allocate resources accordingly.
For example, mapping the spread of infectious diseases can help identify hotspots and enable quick responses to contain outbreaks.
Furthermore, visualization is essential in medical research and drug development. By representing complex biological pathways visually, scientists can better understand the mechanisms behind diseases and create more effective treatments.
Visualizations can also help in identifying potential side effects or drug interactions, allowing for better decision-making during clinical trials.
Visualizing financial data
In the financial industry, visualizing data is crucial for making informed investment decisions. Stock market data, for instance, is often presented in the form of candlestick charts or line graphs, allowing investors to identify trends and patterns.
By visualizing historical performance and comparing it with market data, investors can make more accurate predictions and adjust their strategies accordingly.
Additionally, visualization is also crucial in risk assessment and fraud detection. By visualizing credit card transactions and analyzing patterns, financial institutions can identify suspicious activities and prevent fraudulent transactions.
The role of visualization in urban planning
Urban planning is another area that greatly benefits from visualizing data.
By mapping population density, traffic flow, and infrastructure, city planners can identify areas of congestion, plan for future infrastructure needs, and optimize transportation systems. Visualization also helps policymakers communicate their plans to the public, enhancing transparency and public engagement.
Furthermore, visualizations can be used to simulate different scenarios and predict the impact of urban development on the environment. By understanding how different factors interact, city planners can create sustainable and resilient urban spaces.
Advancements in data visualization technologies
With the advent of technologies like virtual reality (VR) and augmented reality (AR), data visualization has taken a giant leap forward.
These immersive technologies allow users to interact with data in three-dimensional spaces, gaining new insights and perspectives. For example, architects can use AR to visualize how a new building will fit into an existing urban landscape before construction even begins.
Artificial intelligence (AI) and machine learning (ML) technologies have also revolutionized data visualization. These technologies can analyze large datasets and automatically generate visual representations that highlight key trends and patterns.
This not only saves time but also helps uncover hidden insights that may have otherwise been overlooked.
Challenges and considerations
While data visualization offers numerous benefits, there are also challenges and considerations to be aware of. One of the main challenges is ensuring accuracy and data integrity.
Visualizations are only as good as the data behind them, so it is crucial to have reliable and up-to-date data sources. Additionally, data privacy and security must be prioritized to protect sensitive information.
Another consideration is the potential for bias in visualizations. The way data is represented can influence how people interpret it, so it is essential to be aware of any biases that may unintentionally be introduced.
Transparency in the visualization process is key to building trust and ensuring accurate decision-making.
The future of data visualization
As technology continues to advance, the future of data visualization looks promising. With the rise of big data and IoT devices, we now have access to vast amounts of information that can be leveraged to drive progress.
Visualizing this data will become even more critical in making sense of complex interconnected systems.
Furthermore, advancements in AI and ML will continue to enhance data visualization capabilities. Automated data analysis and real-time feedback will empower decision-makers to make more informed choices and course corrections when necessary.
Conclusion
Visualizing data is no longer just a luxury; it has become a necessity in today’s data-driven world. By mapping the present using visual tools, we can uncover insights, make informed decisions, and ultimately drive progress for a better future.
From healthcare to finance to urban planning, visualizing data has transformed industries and will continue to do so as technology advances. As we embrace the power of visual representation, let us remember to use it responsibly, ensuring accuracy, transparency, and privacy in the visualization process.


